The map and the stats bar
Last verified
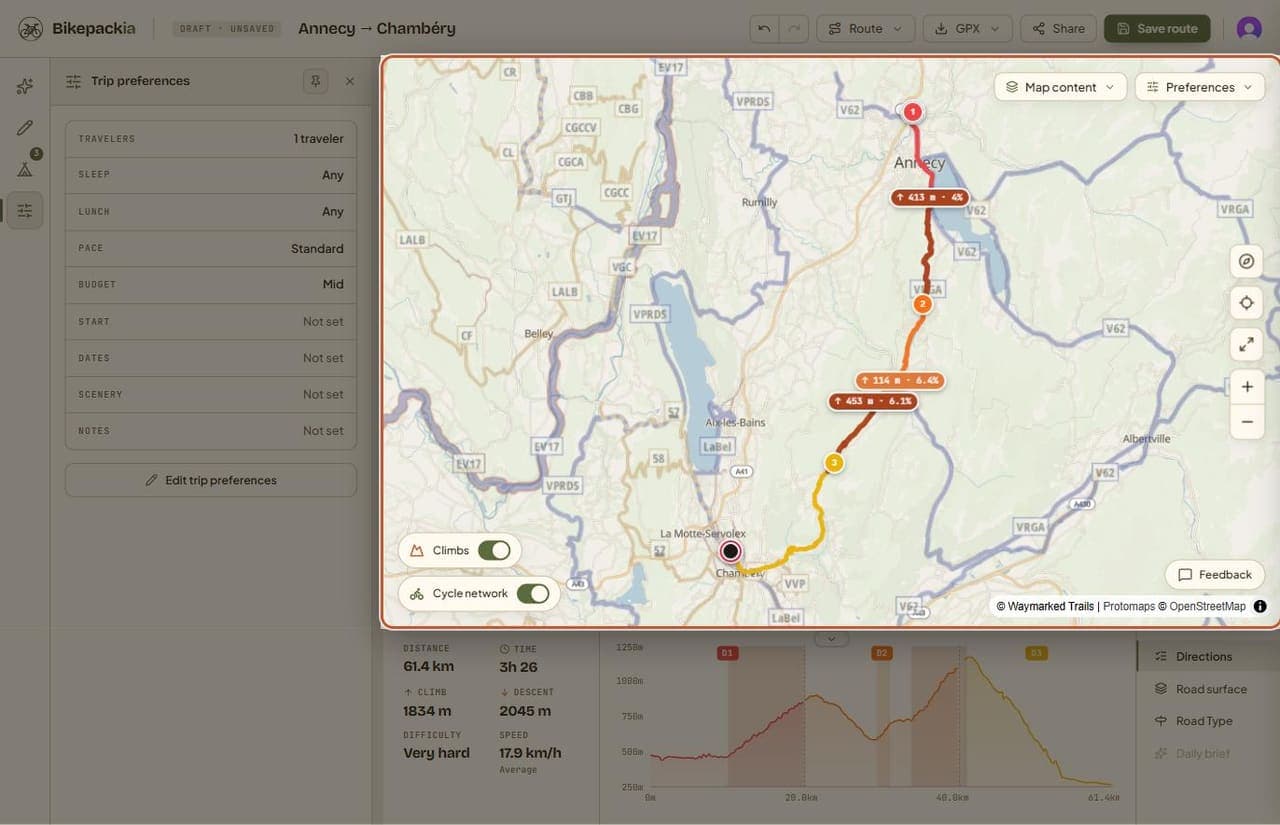
The map fills the right-hand side of the planner. Map content switches the base map and turns on what you want to see (water points, repairers, places to stay and more), the controls on the right zoom and locate, and the stats bar underneath shows distance, ride time, climbing, descent, difficulty, average speed and the elevation profile.
On the map itself
- The route, with numbered markers where each day ends once you've split it into stages.
- Climb badges showing the height gained and average gradient of each climb.
- Route alternatives across the top when there's more than one sensible way, each with its distance and climbing.
- Climbs and Cycle network toggles at the bottom left, for climb shading and signed cycle routes.
Map content
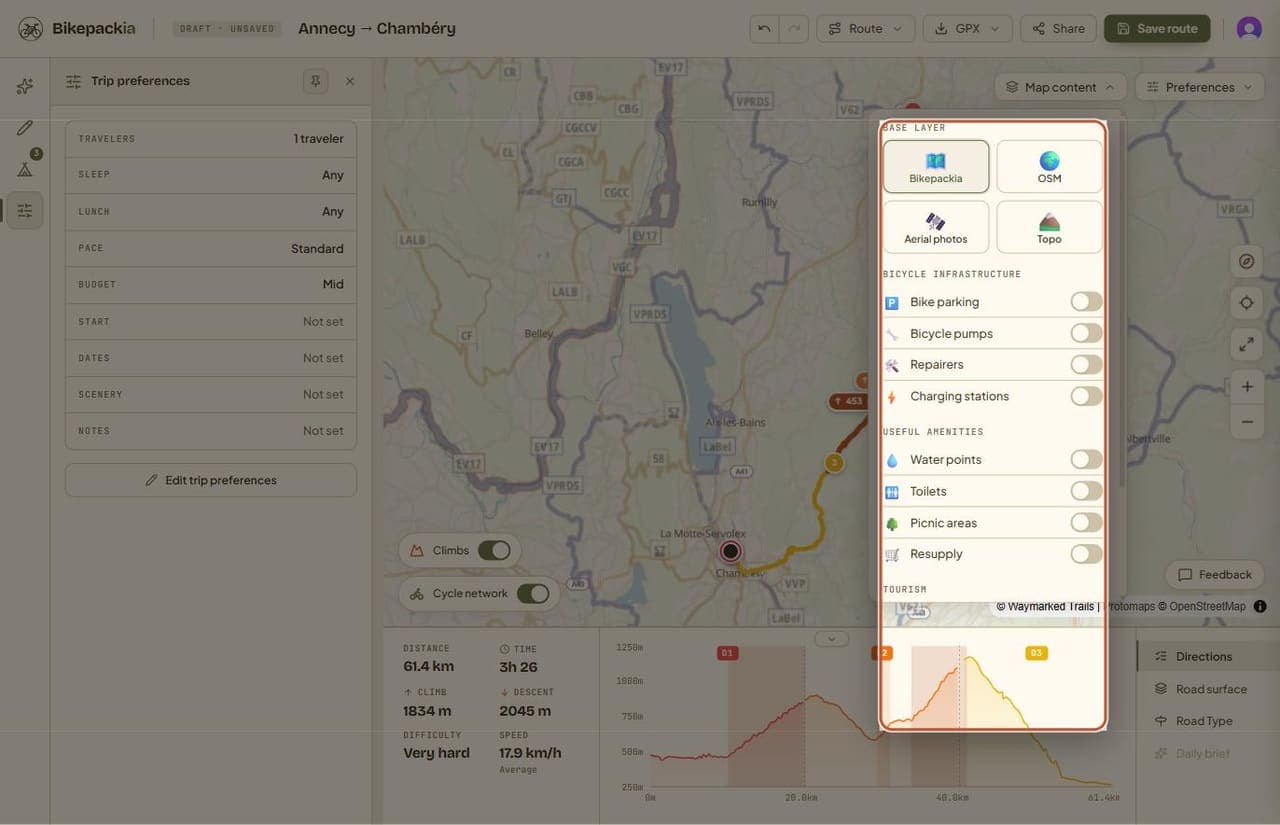
| Group | What you can turn on |
|---|---|
| Base layer | Bikepackia's own map, OSM, Aerial photos or Topo. |
| Bicycle infrastructure | Bike parking, bicycle pumps, repairers, charging stations. |
| Useful amenities | Water points, toilets, picnic areas, resupply. |
| Tourism | Bicycle rental, accommodations, touristic sites, restaurants. |
The Preferences menu next to it toggles the cycling-infrastructure styling of the map. Place data comes from OpenStreetMap, with official French tourism listings added in France.
The stats bar
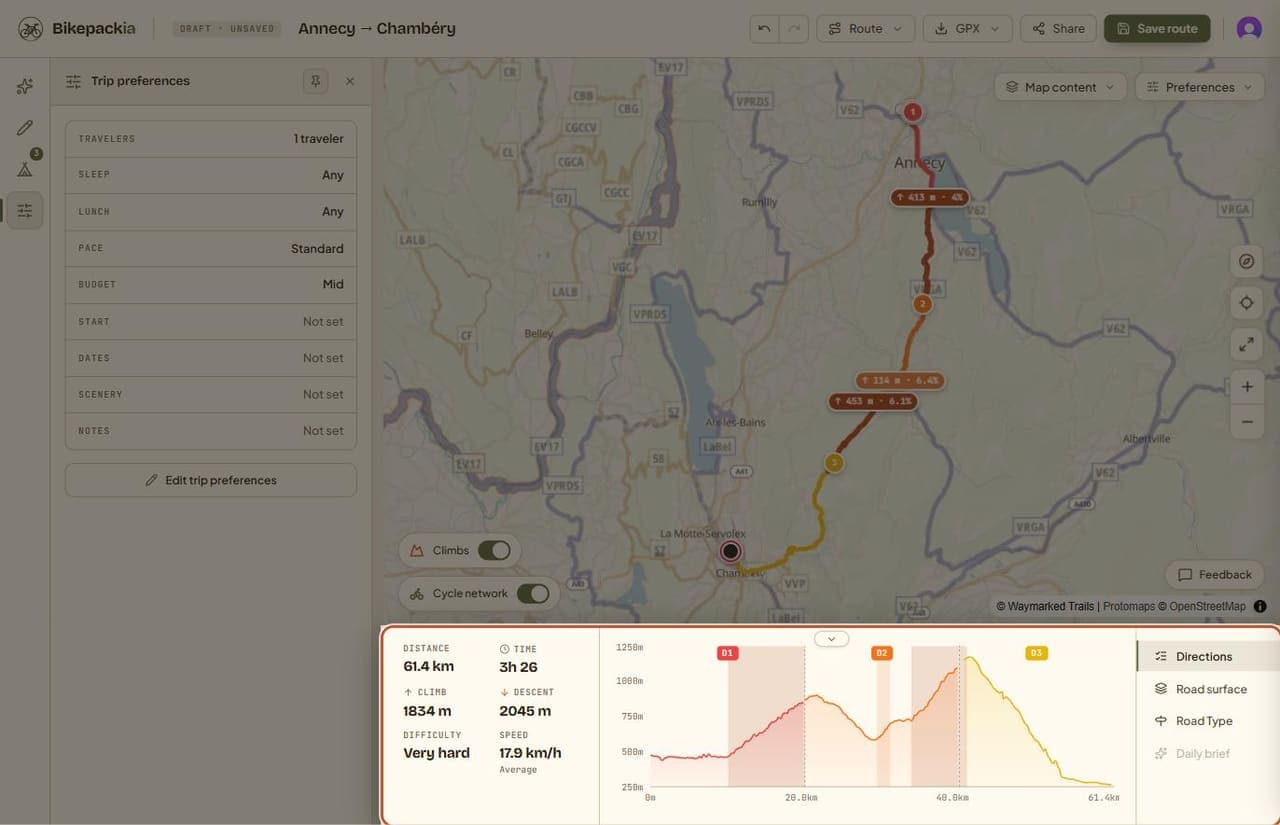
- Totals for the route: distance, estimated ride time, climbing, descent, a difficulty rating and average speed.
- The elevation profile, banded by day once the route is split, so you can see which day holds which climb.
- Directions: the turn-by-turn list for the route.
- Road surface and Road Type: what the route is made of, when the routing engine reports it.
- Daily brief is not available yet.
Frequently asked questions
How do I find water along my route?
Open Map content and turn on Water points under Useful amenities. You can also ask Mec to find water near a point of the route and pin it to a day.
Can I see the route on satellite imagery?
Yes. Open Map content and pick Aerial photos as the base layer. There's also a Topo map.
What does the difficulty rating mean?
It's a summary of the route's distance and climbing, shown in the stats bar next to the totals. It's a guide, not a grading standard.