Elevation and climbs
Last verified
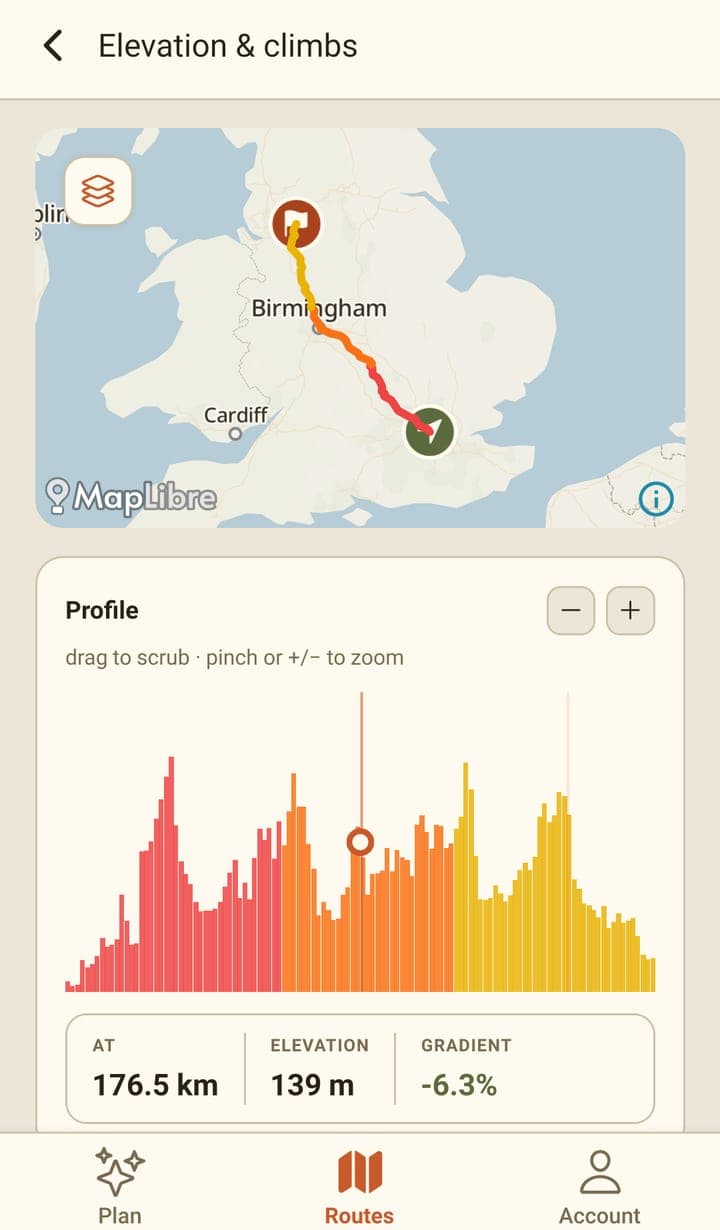
Tap 'Scrub it' on the route screen for the full elevation view. Drag across the profile to read the distance, height and gradient at that point, and pinch or use +/− to zoom. Below it are the climbs on the route with their length and average gradient, your totals — climb, descent, steepest sustained gradient and ride time — and the mix of roads and paths the route uses.
Reading the profile
- The bars are coloured by day, matching the colours on the map.
- Drag anywhere on the chart to move the marker; the three figures below follow it.
- A negative gradient means you're going down.
- Zoom in with the + button or a pinch, and Full route takes you back out.
Climbs
Bikepackia picks out the climbs worth knowing about and grades them, the way cycling does, from Cat 4 up to Hors Catégorie. Each climb card shows where it starts, how long it is, its average gradient and how much you'll climb. Tapping one jumps the profile to it. A route with no long sustained ascents shows no climbs even when the total climbing is high — that means the height comes in short lumps rather than a proper climb.
Totals and surfaces
| Figure | What it means |
|---|---|
| Total climb / descent | Metres up and down across the whole route. |
| Max gradient | The steepest sustained gradient, with one-off spikes in the data filtered out. |
| Ride time | A range for the whole trip, based on your bike type and pace. |
| Surface breakdown | The share of the route on bike paths, unclassified roads, tertiary roads, residential streets and so on. |
The surface breakdown describes the kind of way — bike path, lane, residential street — which is not the same thing as the 'unpaved' percentage on the route screen. A quiet tertiary road can be sealed or not.
Frequently asked questions
Why does my route say 0 climbs when it has 2,000 m of climbing?
Because the climbing is spread over lots of short rises rather than long sustained ascents. Only climbs long and steep enough to be worth naming are listed.
Why is the max gradient lower than a spike I can see in the chart?
Elevation data carries occasional bad readings that would report absurd gradients, so Bikepackia smooths them out and reports the steepest sustained grade instead.